

ほんっっっっっっ・・・・・・

?!
っっっとに多いなあ、法則やら理論やら!算数か?理科か?
落ち着いて!それをいうなら数学か物理か?だよ!
んなこたあどうでもいいんだよ!どうせまた役に立つ知識なんだろ!勉強してやらあ!
グランビルの法則とは
グランビルの法則とは、アメリカのアナリスト「ジョセフ・E・グランビル」氏が考案した相場理論のことだよ!移動平均線(MA)やローソク足を使ったチャート分析で多くの投資家に活用されていて、
「買いの法則」4つと「売りの法則」4つに分類されるんだ!
アメリカ人提唱するの好きすぎだなあ!
まあ金融大国だからね。
分析家も星の数ほどいて、その中からうまく活用できる理論がいくつも出てくるのは当然だと思うよ!
とりあえずどんな法則かざっくりと図で表すと・・
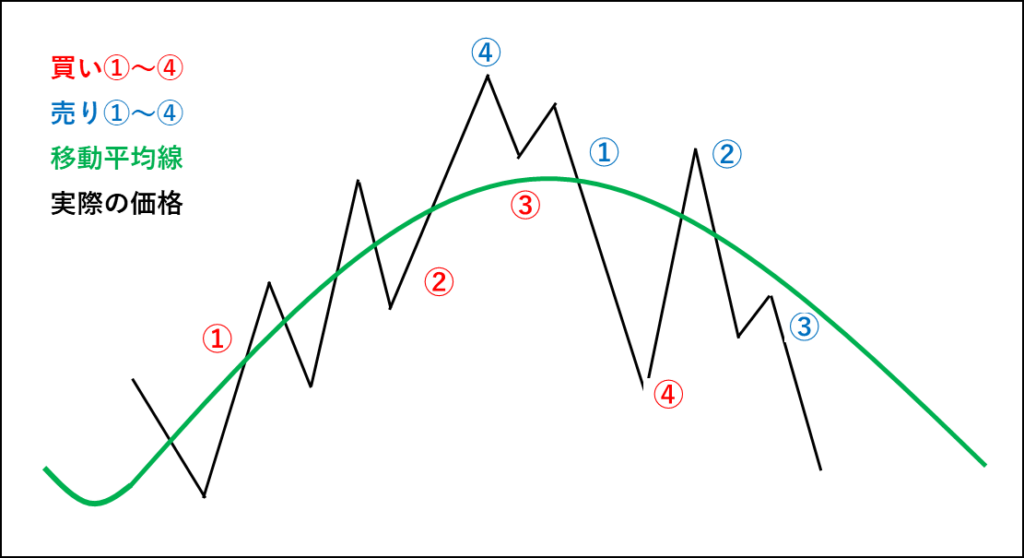
こんな感じだね!
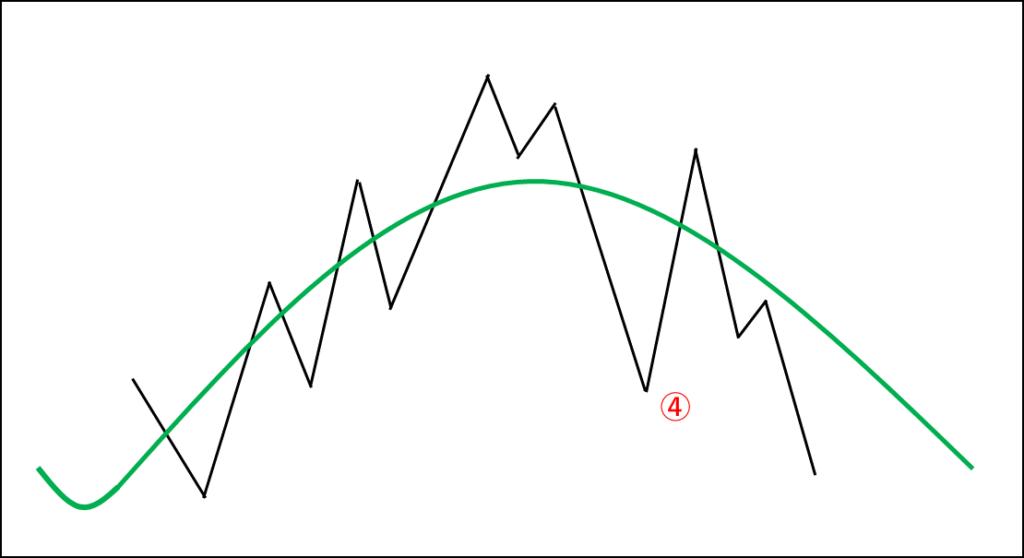
買いの法則① 移動平均線が上向けし、価格が移動平均線を上抜けしたタイミング
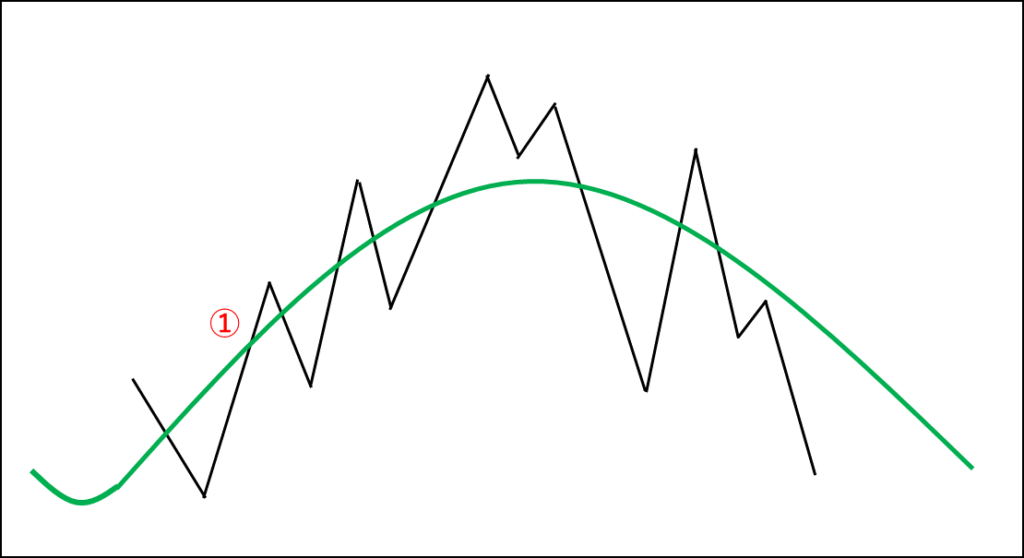
移動平均線が下降から上昇に転じているってことはこの前は下落傾向だったんだな?
そうだね!下向きや横這いの移動平均線が上昇傾向に転じたと見極めることがポイントだよ!
そして価格が上昇傾向の移動平均線を上抜けしたときが一番最初の買いのシグナルとなるんだ!
底値圏で買えればそれだけ大きな利益が狙えるからよく観察することが大切だよ!
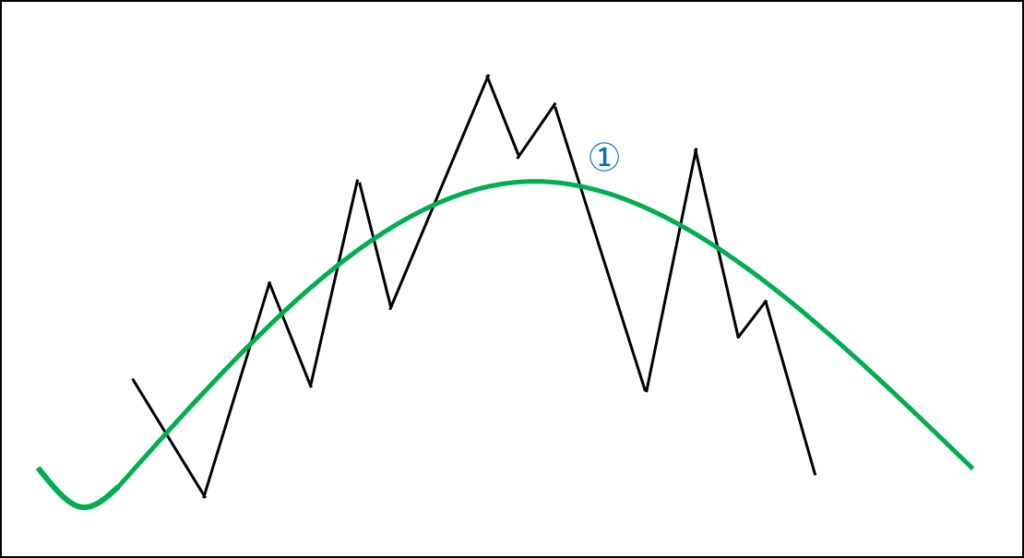
買いの法則② 移動平均線が上昇中、価格が移動平均線を上抜けし、再度下抜けしたタイミング
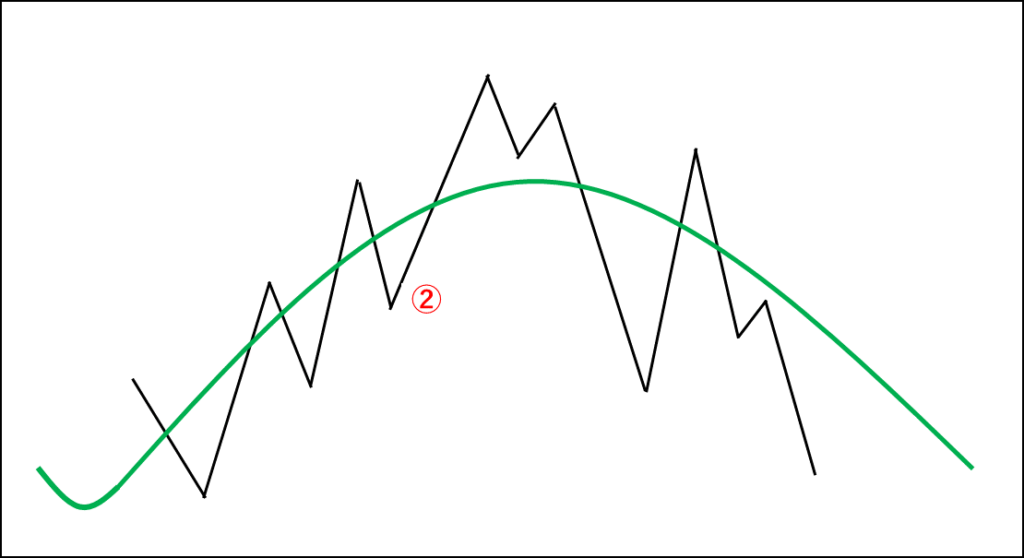
ここはどういうポイントなん?
「価格は移動平均線に戻ってくる」という特性を利用した法則だね!
移動平均線は上昇を保っているから価格が下抜けたとしても上昇に転じるという根拠に基づいての
買いシグナルだね!
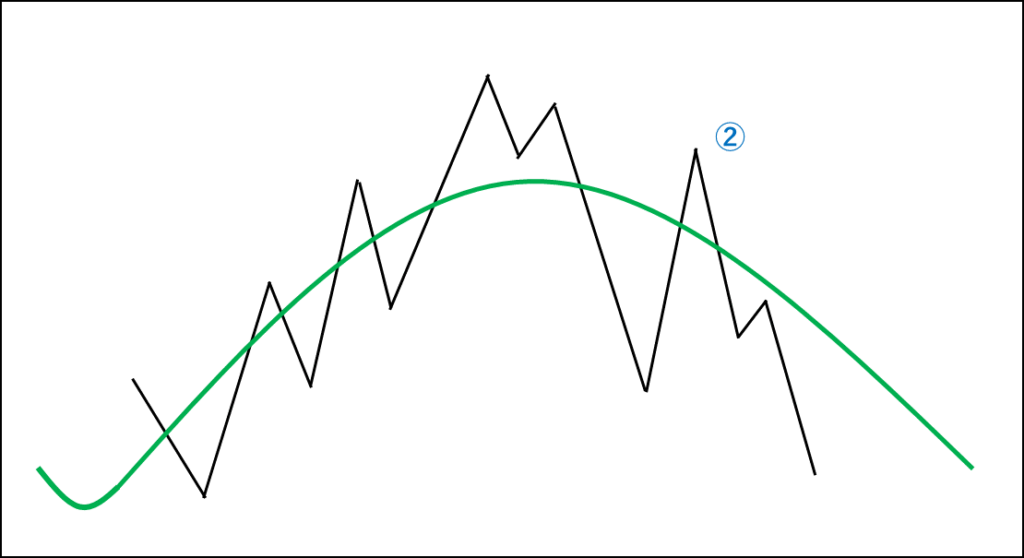
買いの法則③ 上昇中の移動平均線に向かい、価格が下がり移動平均線の手前で価格が上がったタイミング
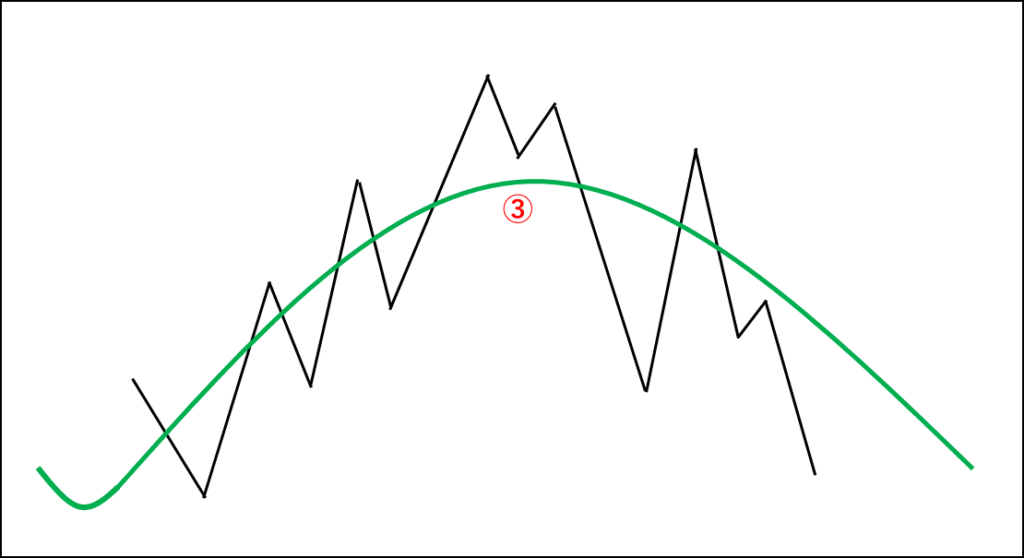
移動平均線を下抜けしないのか、相場に勢いがあるってことか?
そうだね!ここはわかりやすい買いのシグナルだよ!サポートラインが移動平均線より上回っている場合は勢いがある証拠だからね!
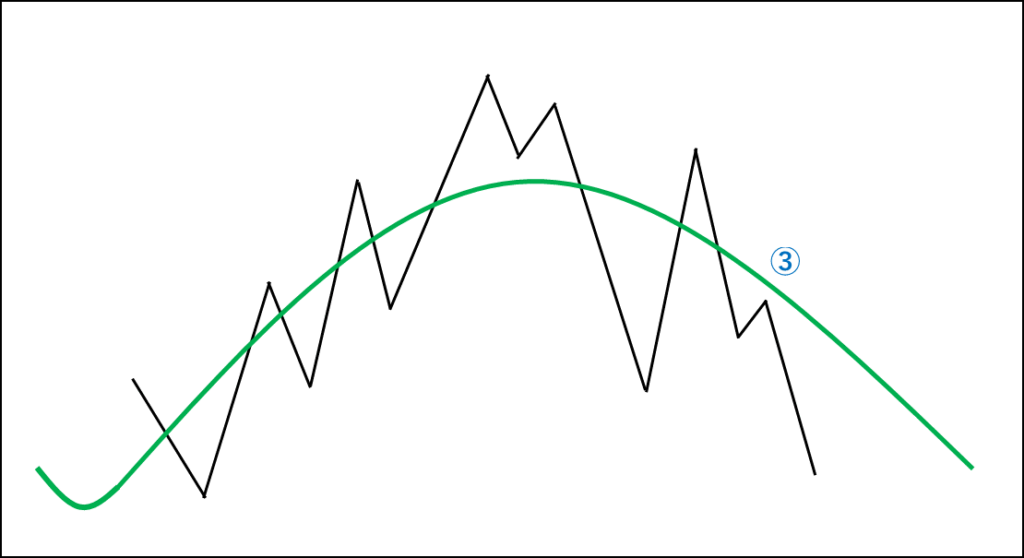
買いの法則④ 下向きの移動平均線と価格が大きく乖離したタイミング
ん?トレンド下降し始めて安値のとこなのにか?
そうだね!ここが最後の買いのシグナルなんだけど下降トレンド中になるんだ!
ここでも「価格は移動平均線に戻ってくる」というのをポイントとして考えてみるとわかりやすいかな?
下降トレンドでも移動平均線への反発の可能性があるから乖離してればしてるほど利益が狙えるってわけか
売りの法則① 移動平均線が上昇後、横ばいか下降に転じて価格が平均線を下抜けしたタイミング
「買いの法則①」の逆バージョンみたいなもんか
そうだね!最初の売りポイントで、たとえ横這いであってもトレンド転換の可能性があるからここでエントリーする投資家は多いとされてるんだ!
売りの法則② 移動平均線が下降時に価格が大きく下落し再度上昇後、価格が移動平均線を上抜けたタイミング
ここも「価格は移動平均線に戻ってくる」の習性を活用するのか
うーんまあそうなんだけど過度に信用しないようにね?
大きく下落したあとはその分反発して戻るからそのあとに上抜けするところは
絶好の売りタイミングといわれてるんだ!
売りの法則③ 移動平均線が下降時に、価格が下落して反発しても移動平均線を上抜けしないタイミング
ここは・・「買いの法則③」の逆バージョンな感じか
そうだね!この局面は移動平均線がレンジスタンスラインの役割をはたすこともあるから
初心者にとってはエントリーしやすいポイントとされているよ!
売りの法則④ 価格が移動平均の上に大きく乖離したタイミング
これ見る限りだと上昇トレンド中なんだが売りシグナルなんか
そうだね!上昇トレンドといってもやはり「価格は移動平均線に戻ってくる」からその反発を利用しての売りのシグナルとなるんだ!
ただ逆張りの取引だから初心者にとっては見極めのタイミングとしては難しいかな?
FXチャートでの設定期間
「FXチャートの基礎知識 テクニカル分析」にあったけど移動平均線って期間指定できるよな?
グランビルの法則に推奨期間があるってことか?
そうだね!グランビル氏がこの法則を提唱した時のチャートは、日足で200日の移動平均線が使われていたことから200日が推奨というか200日で使うことを前提としてるよ!
200日?気が長げえなあ・・スイングやポジショントレードでしか効力発揮しないようなもんか?
いや、もちろん200日移動平均線で日足チャートが基本なのはそうなんだけど、
短期取引にも応用できるよ!
例えば「1日」を「1時間」に置き換えて考えてごらん?
うーん?つまり200時間の移動平均線をとればいいってことか?
1日が24時間だから200÷24=8.33333…..日?ん??なんかややこしくないか?
そこまで細かく設定する必要はないよ!
例えば1時間足で5日間の移動平均線と10日間の移動平均線を表示させてみるとか。
それを比較して信用性の高い方を法則に当てはめちゃえばいいんだよ!
なるほどなあ、色々アレンジして試してみることも大切なんだな
そうだね!ほかのインジケータなんかとも組み合わせて自分が理解しやすいようなチャートを表示することが大切だよ!
まとめ
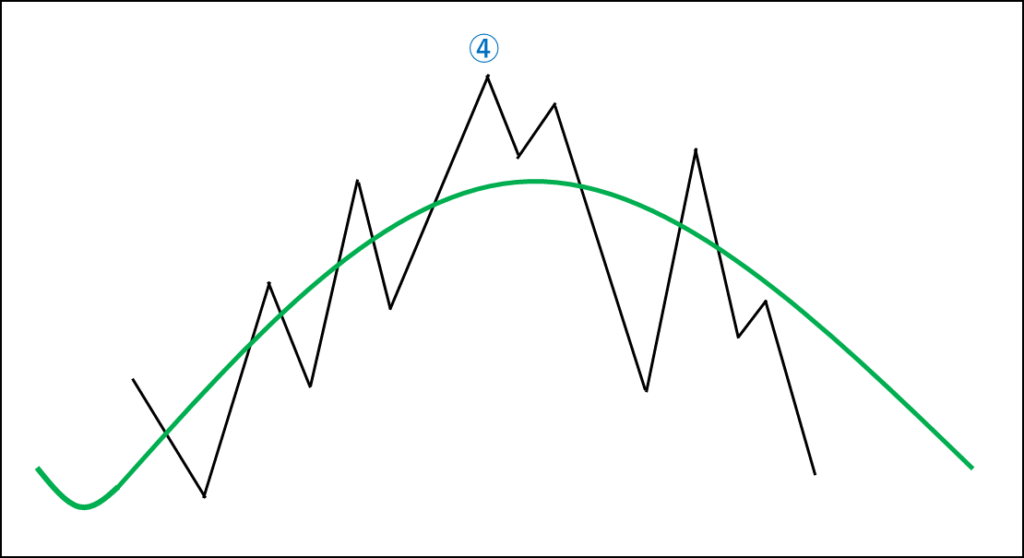
まあシグナルの指標としてはわかりやすいんだが、実際のチャート見るとこんな感じで推移してるわけでもなく・・
説明のためにわかりやすい値動きにしたから必ずしも図のようなチャートを形成するとは限らないよ!
ただそれでもこういう値動きをする前提で提唱された法則だから勿論そのとおりに推移することももあるからね!
グランビルの法則で一番大事なのはグランビルの法則を参考にするのではなくて目の前のチャートを見てどこの法則に当てはまるかを判断するという観察眼を身に着けることだよ!
それじゃ今回はここまで!江布江クン頑張ってね!